Trusted by Top-tier product campanies


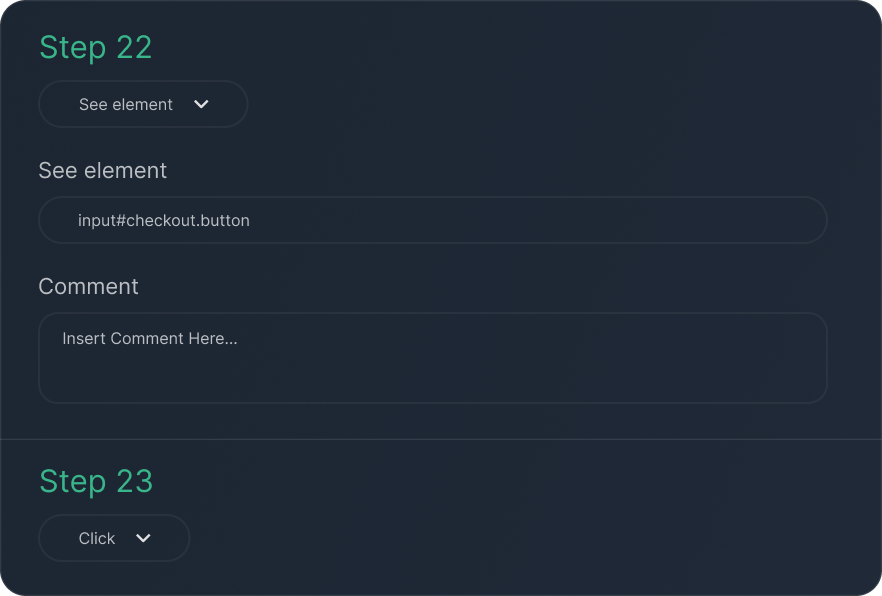
Define detailed synthetic tests to simulate real-world user interactions. Customize steps, conditions, and validation points to replicate how users interact with your application.
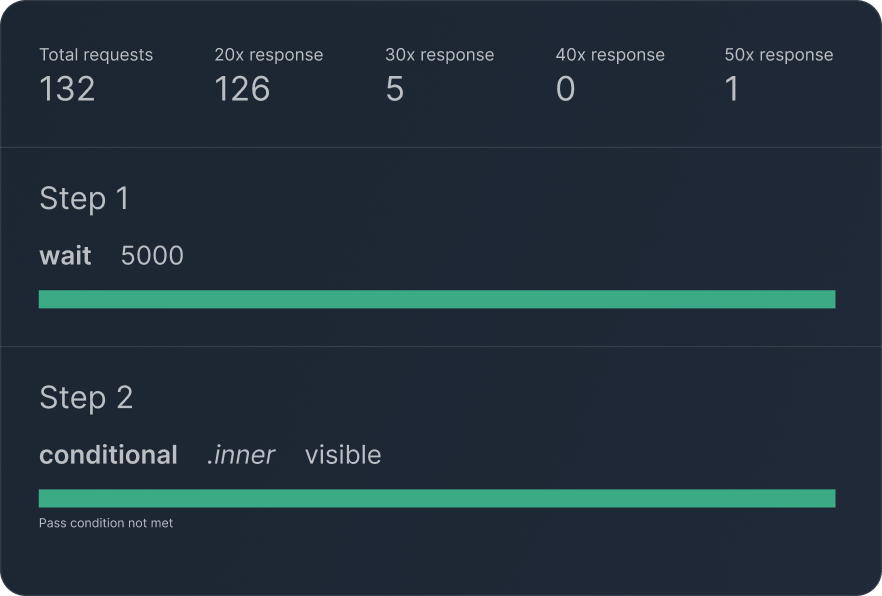
Gain insights into every aspect of your website's synthetic test results through a dynamic dashboard. View performance details, request logs, console messages, and execution status all in one place.
Validate UI and UX flow with captured screenshots and video recordings of synthetic test batches. Perfect for spotting visual errors or delays as users would experience them.
Enhance security with domain whitelisting and IP blacklisting to control access and protect journeys.

We provide a custom email for every monitor which can be used to receive emails during the monitor execution.

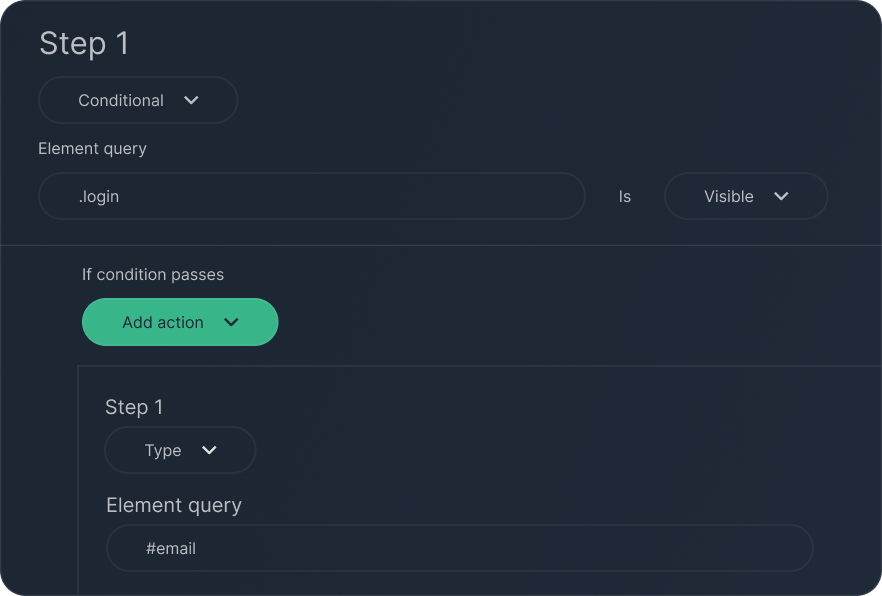
Set up conditional journeys to test different scenarios based on element visibility. This feature helps you simulate user interactions based on specific conditions.
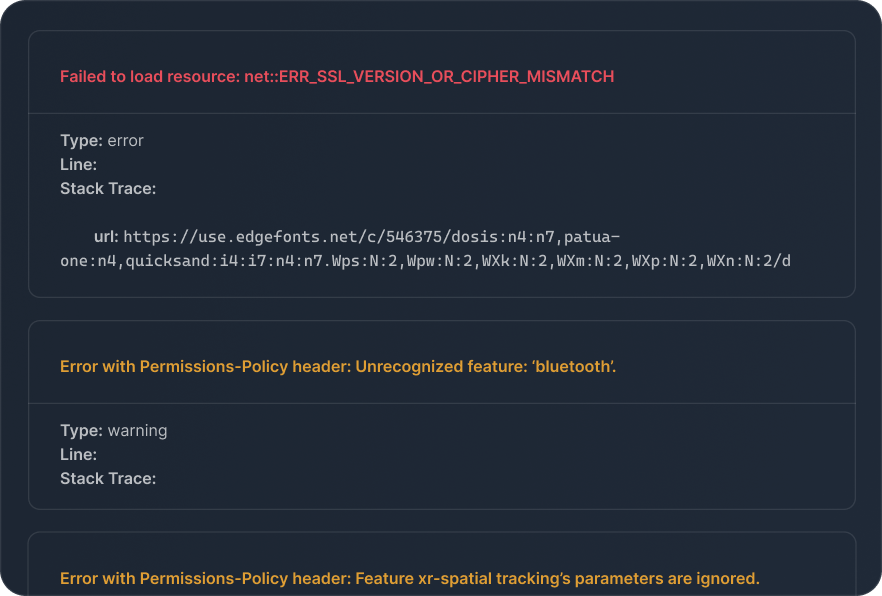
Debugging is simplified with in-depth console logs and AI-driven request analysis. See precise issues and their origins within the console for a faster resolution of performance and functional problems.
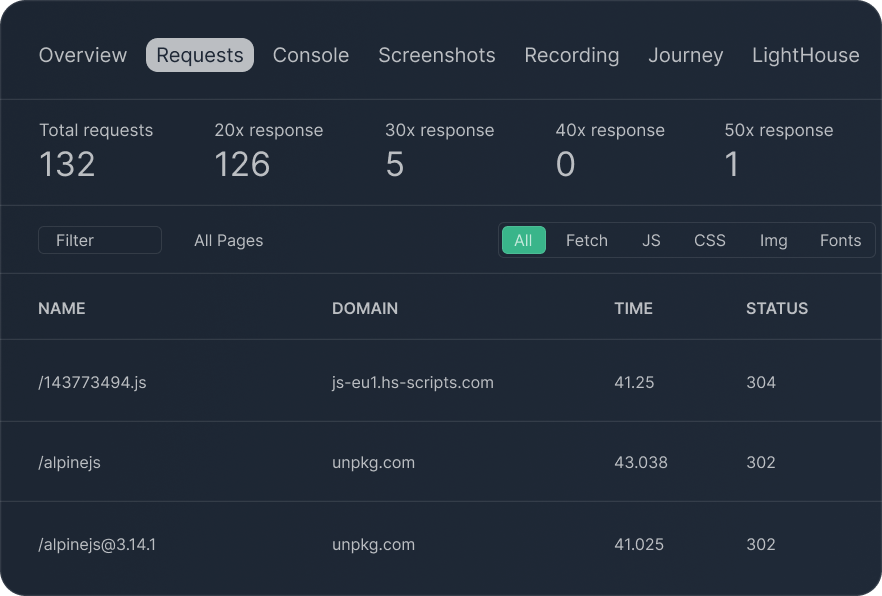
Easily filter test requests by content type (CSS, JavaScript, images, fonts, etc.) and HTTP status, helping you quickly focus on critical metrics without information overload.
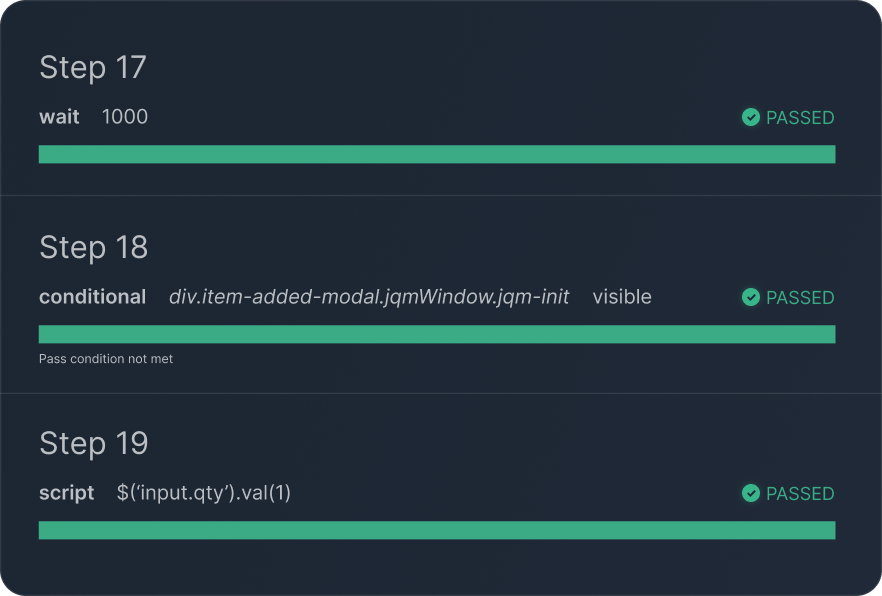
Monitor your user journeys with stepwise success or failure insights, complete with screenshots and video recordings that help you identify critical experience-impacting issues.
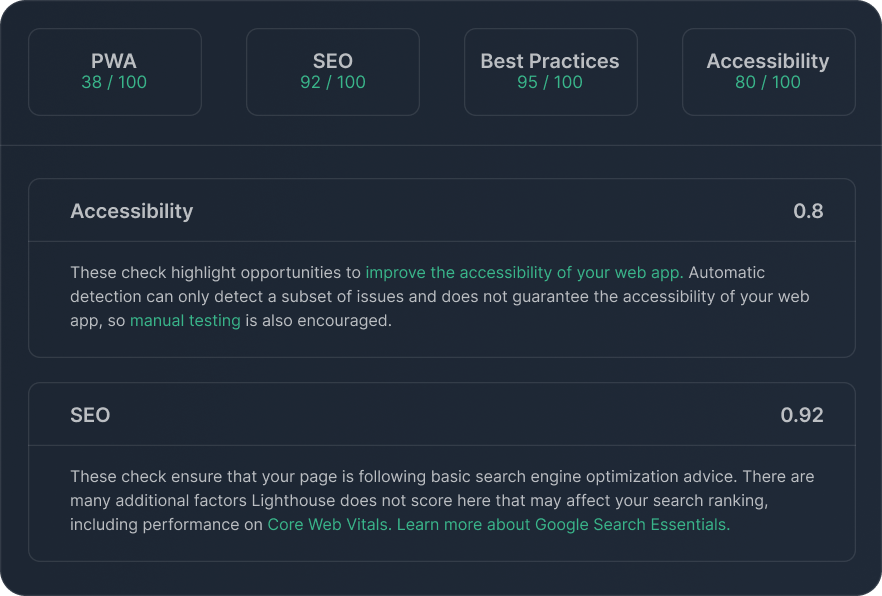
Incorporate Google Lighthouse metrics directly into the synthetic monitoring reports for deeper, SEO-relevant insights into performance, accessibility, and best practices.
