Trusted by Top-tier product companies



Scheduled HTTP checks against a URL, from more than one region. A run stores status, latency, headers, host IP, and DNS resolve time. It tells you the endpoint answered. It does not walk a checkout, and it does not watch a cron job.
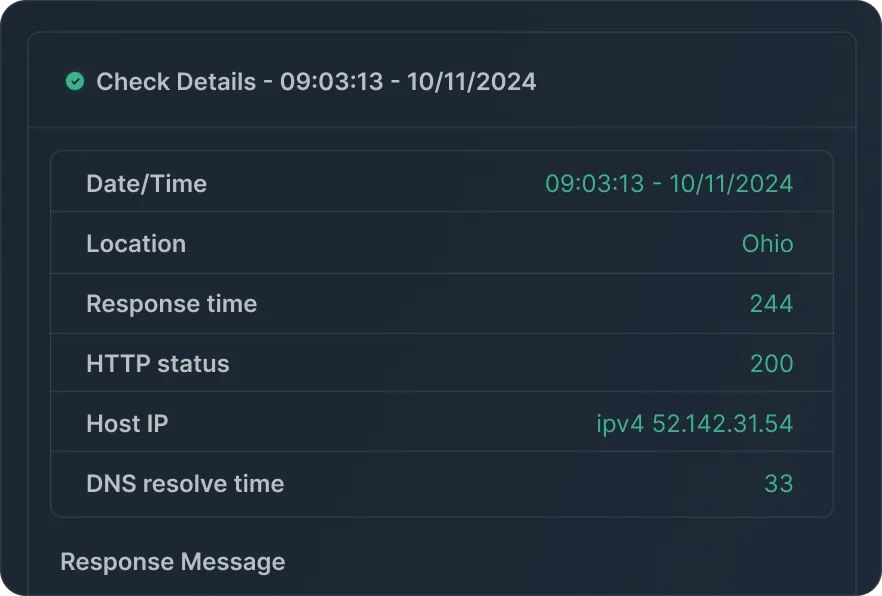
Learn moreEach run records the status code, response time, headers, host IP, and DNS resolve time. Healthy codes default to 200–299. Add 301 or 302 when a redirect is expected. A code outside that list, or a timeout, is a failed check.
Point an uptime test at an API URL the same way you point it at a site. You still get status, latency, headers, and an optional string match, over GET or POST. Chained requests, auth tokens, and JSON field assertions are API monitoring, a separate test.
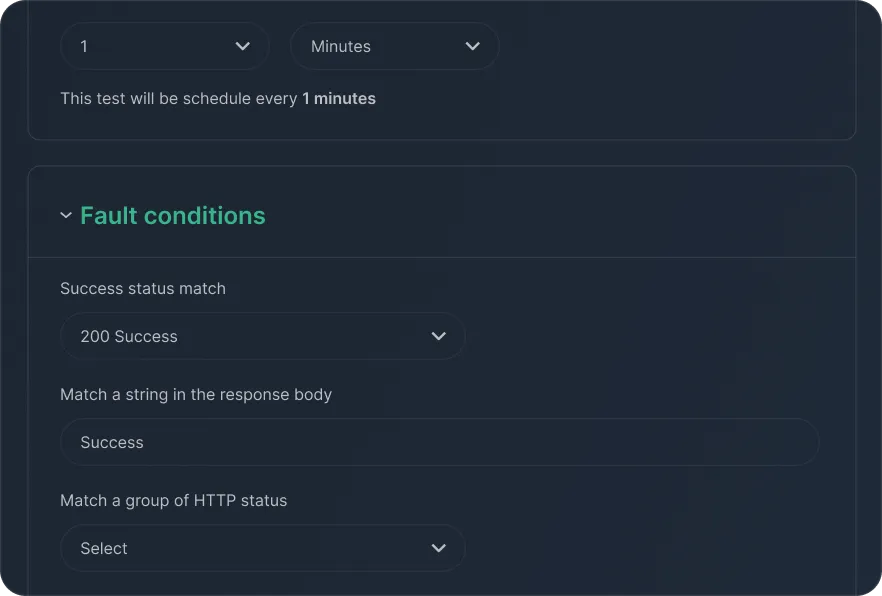
A 200 can still be the wrong body. Require a string to be present, or fail when an error string is present. This reads the HTTP response. It does not inspect the rendered layout. Screenshots, video, and button clicks belong to synthetic monitoring.
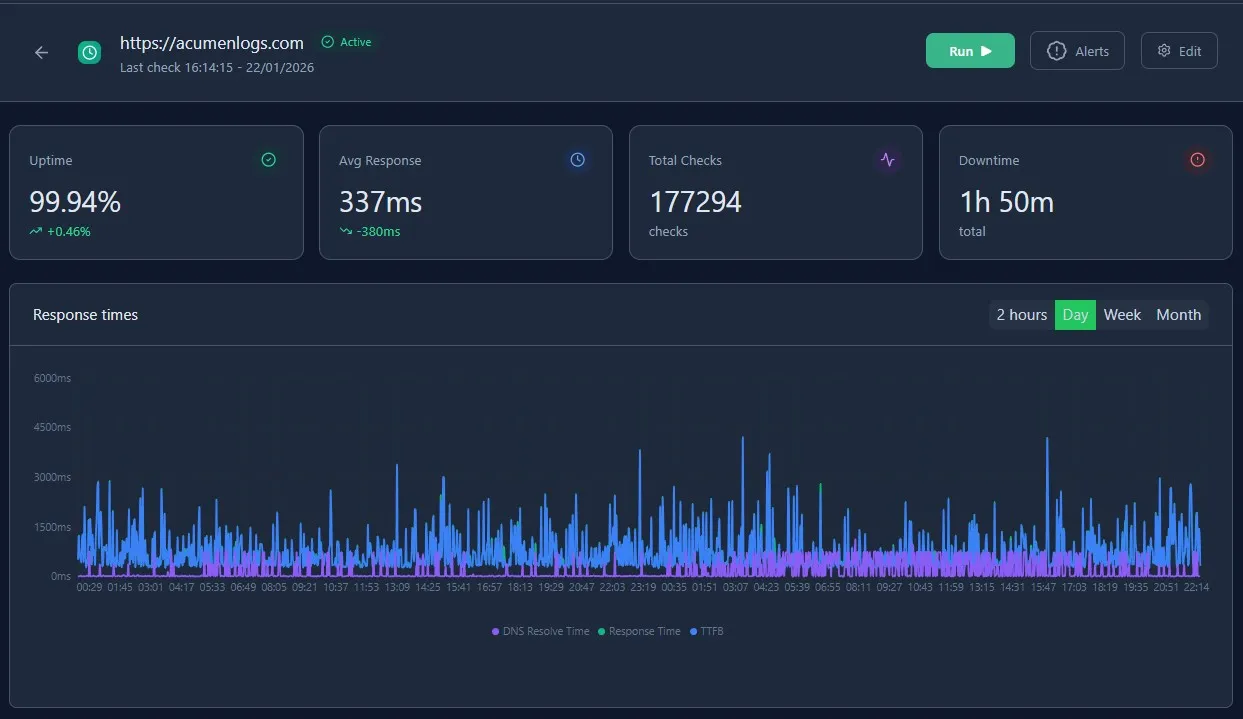
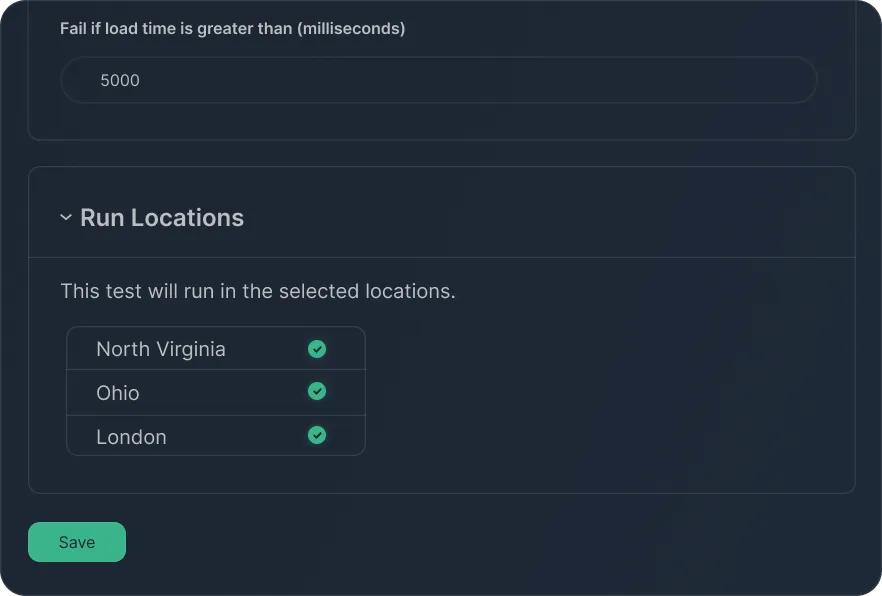
Set a latency limit in milliseconds. A region that crosses it fails that run. The dashboard graphs response time for the last 2 hours, day, week, and month, and you can hide regions to see whether a spike is local or everywhere.
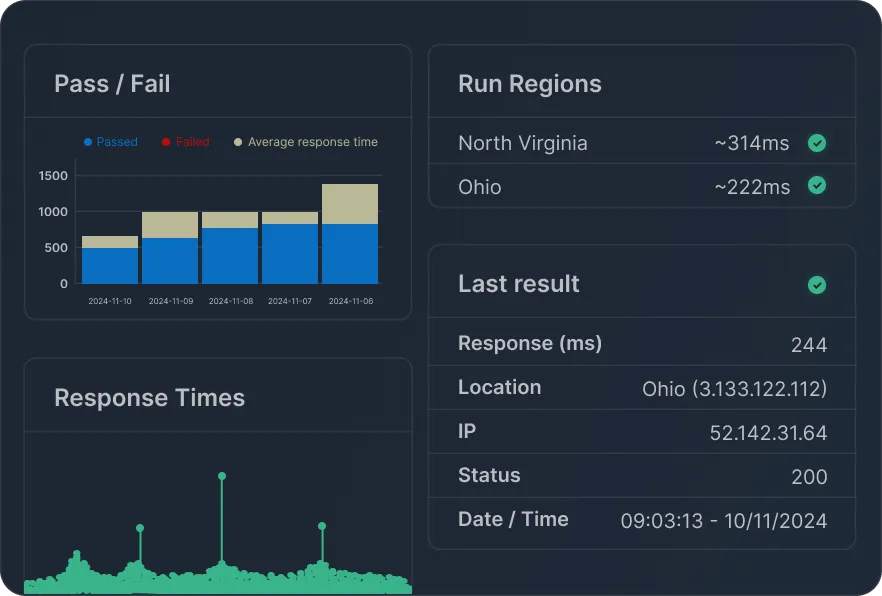
Every result includes the region. If one location spikes, compare it with the others before you treat it as a full outage. The response-time graph lets you toggle regions. A single-region spike points at routing or the CDN. A spike in every region points at the service.
Checks run every 1, 5, 10, or 30 minutes. One-minute checks start on Solo at $5/month. The free plan runs 10 uptime, SSL, and WHOIS checks every 10 minutes and keeps 3 days of history. Uptime alerts go to email, Slack, Teams, desktop, or webhooks, after the consecutive fail count set on that channel.
Quickly audit your website and infrastructure using our suite of free tools and checkers. Our lightweight set of tools allows you to scan for sudden downtime, verify certificate expiration dates, and look up domain registration details instantly without an account to protect your brand ecosystem.
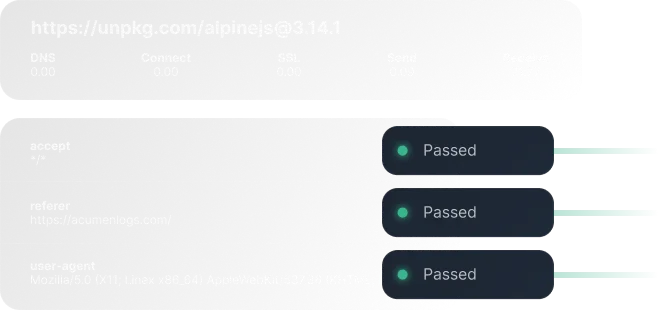
Simulate real user journeys in the browser to catch broken flows, JavaScript errors, and slow pages before they impact revenue. Build and maintain journeys without code, validate key steps like logins and checkouts with screenshots, and videos when something fails.
Learn more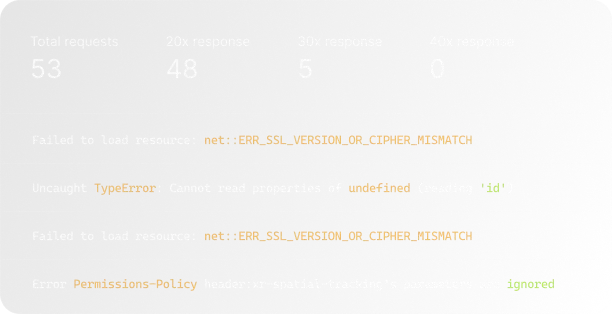
Track mission‑critical flows such as signup, checkout, and dashboards end‑to‑end, not just single pages. Acumen Logs surfaces failed network requests, console errors, and regressions in real time so your team can resolve UX issues quickly.
Learn more